Outcomes Tools: Downloading Data as an Image
Please log in to your account in order to access this material.
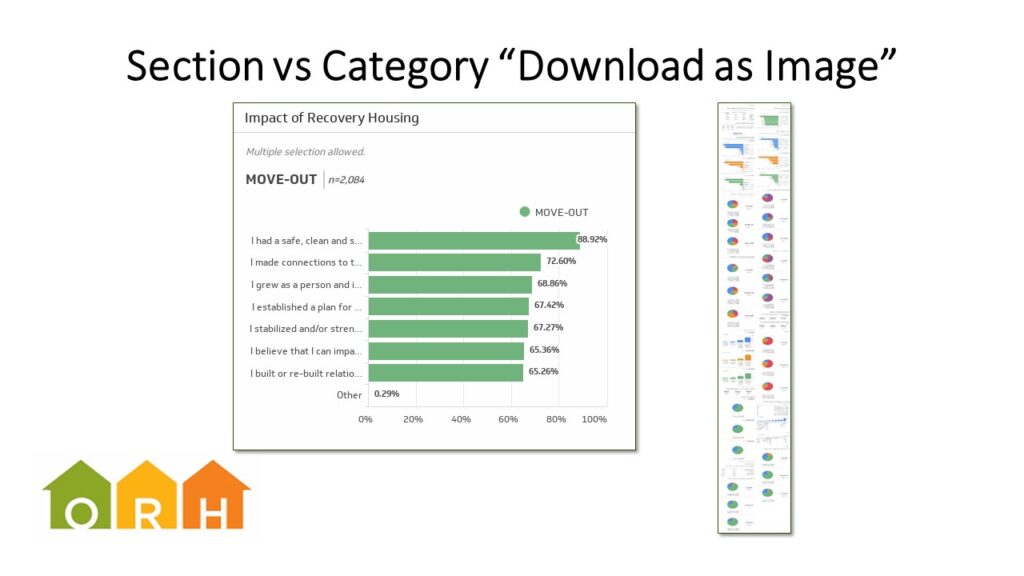
Know that how you download data as an image may result in vastly different presentations. Here we have a section image verses a whole category image. You may not need all the data as an image. You may need only a section or a specific data topic for your community outreach and grant proposals.
Course Syllabus
Not Enrolled