Outcomes Tools: Data Dashboard Selections
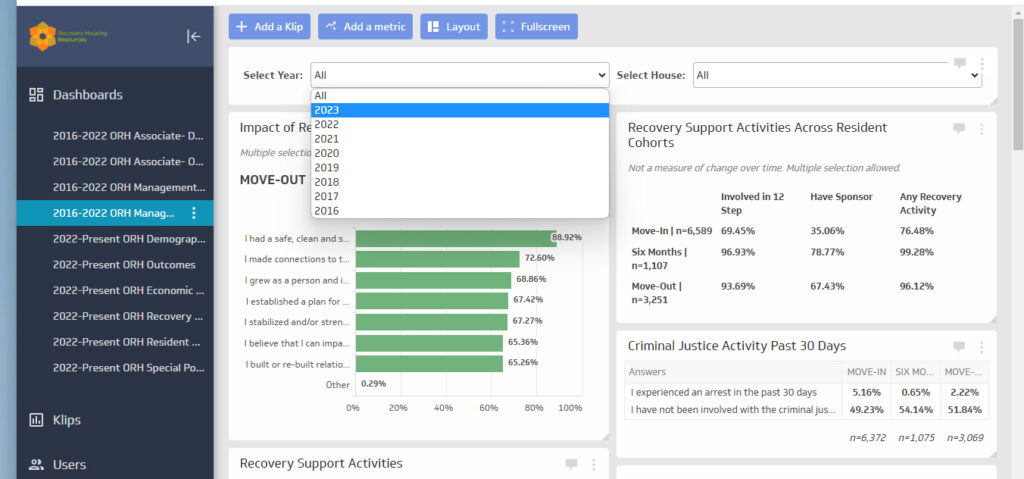
When viewing data, it is important to select the right year. No data will show if you select years from before your organization joined the outcomes tools initiative.
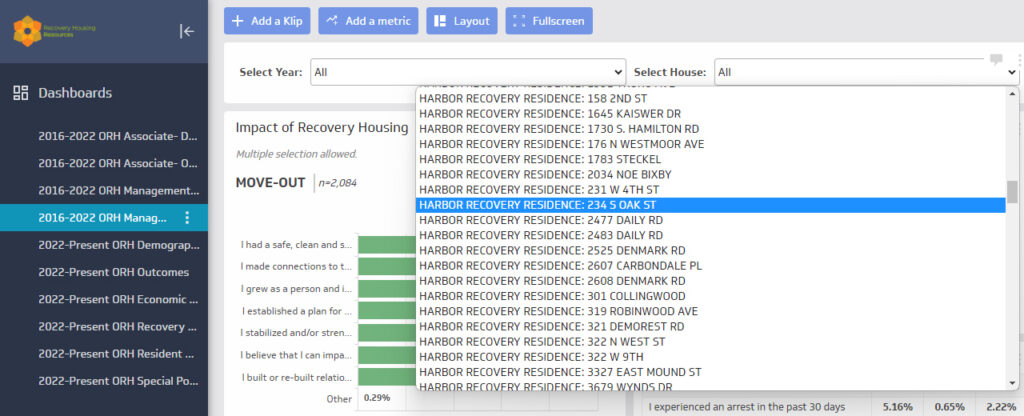
Also, if you have more than one house, it is important to select the right house. If you have only one house, only that house will appear in the drop-down menu. Please note: in these images, we are viewing ORH’s view of the dashboard where we can see all the data. Your view will only display data from your organization’s house or houses.
 The outcomes tools have been collecting data since 2016, but you may have only recently joined the outcomes tools initiative.
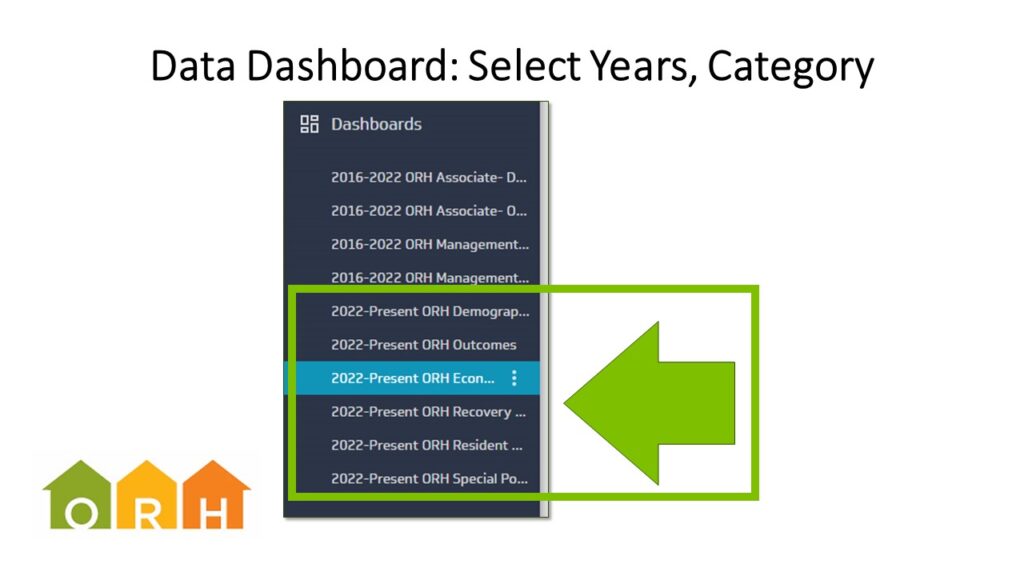
So, you should only select the 2022 to Present data tab on the left of the dashboard. Otherwise, the data will look incomplete from those early years. Also on the left are tabs where you can view certain categories, such as economics data, recovery support data, resident demographics.